December 17, 2021
Final Paper Excerpt
Analysis completed in R
I present Chicago rail and bus transit data alongside rideshare data for the years 2019 through 2021, making the argument that throughout the COVID-19 pandemic, rideshare functioned as a substitute for transit, more specifically, used to fill gaps in poor transit service. I perform this analysis with special attention to the effects of the pandemic on how low-income users travel, using it to explore the already understood relationship between income and transit ridership in a new context (APTA, 2017).
The COVID-19 pandemic changed travel behavior for most of the population in the United States, starting in mid-March of 2020 when cities like Chicago initiated shelter-in-place orders and placed travel restrictions on non-essential travel (City of Chicago, 2021). It was at this time that many businesses closed and let workers go, others transitioned to work and school from home over platforms like Zoom, and others continued to work and support basic services such as grocery stores, hospitals, restaurants and more. Those that supported the services were colloquially referred to as essential workers, those who for a variety of reasons either chose to or were forced by financial constraints to continue commuting and working.

While many workers no doubt continued to drive to work, I begin from the assumption that a disproportionate number of essential workers were users of transit because they are also likely on the lower end of the earnings spectrum. Some may have migrated to other modes to avoid the chance of infection, opting to carpool, cycle, and walk instead. This ability would have been predicated on the availability of alternative choices, choices that would not be available to all, especially lower-income, non-white residents. For example, on Chicago’s Northside where there is a culture of biking supported by extensive bike infrastructure, it would have been easier to switch cycling than for someone on the Southside where bike infrastructure is sparser and job opportunities are further. In some neighborhoods on the South and West side, 20% of households or more did not have access to a single vehicle making it difficult to migrate to driving or carpooling (U.S. Census Bureau, 2020), The important point is that while some might have been able to switch to travel modes that minimized proximity to other people, others, mostly lower-income residents on the South and West sides, had fewer opportunities to do so.
CTA Delays
While the Chicago Transit Authority has maintained that it has not reduced service throughout the pandemic (Greenfield, 2021a), anecdotal evidence and discussions across social media suggested this was not true. Riders reported delays and ghost trains or busses, vehicles that were on their way according transit tracking but that never actually arrived (Greenfield, 2021b).
In the Fall of 2021, several pieces in Chicago’s local media have shined some light on the cause of these delays through interviews with Amalgamated Transit Union Local 241 President Keith Hill and CTA spokesperson Brian Steele, concluding that labor shortages are to blame (Greenfield, 2021b; Freishtat, 2021). Union President Hill claims attrition is due to higher rates of retirement and extended sick leaves, and that after months of no hiring activity taking place during the pandemic, the number of new operators presently being trained is a small fraction of pre-pandemic numbers (Greenfield, 2021b). CTA spokesperson Steele maintains that the agency did not cut service but that despite attempts to keep extra operators on hand to fill gaps in service, the pandemic stretched the capabilities of the agency to fulfill its duties (Greenfield, 2021b).
Freishtat (2021) reports that prior to the pandemic, 92% of planned rail transit runs were made and that number has dropped to around 70% for most lines during the pandemic. Neither article touches on the depth of bus service cuts, but we can imagine that the number of missed runs is comparable if not worse; first, because many more bus routes than rail lines are operated, and second, because bus drivers are in more intimate contact with passengers and might feel a more acute sense of fear around being exposed to COVID-19 (Rahimi et al., 2021).
Given the unreliability of Chicago Transit Authority services and the overall atmosphere of distrust and frustration with its service due to pandemic labor shortages, it would be reasonable to conclude that this has created additional pressure for some to migrate to other modes of commuting during the pandemic. Specifically, many are likely to turn to rideshare as it provides faster door-to-door service and minimal contact with others. I turn to rideshare data in North Lawndale to suggest that disruptions in transit service have effects beyond just longer commutes, they also result in larger transportation spending burdens for low-income residents who make up the larger proportion of those that continued to be mobile during the pandemic.
The Burden of Rideshare
Just as transit saw decreases in utilization due to less need to travel, so did rideshare. In 2019, the City of Chicago saw over 110 million rideshare trips (City of Chicago, 2021b). In all of 2020 and in the months through October of 2021, Chicago made 50 million and 35 million trips respectively. But just as there was unevenness in who had to continue to use transit, there are also discrepancies in who continued to utilize rideshare, a more convenient travel mode though many times the price of public transit.


Looking at one Chicago’s low-income, majority-Black neighborhoods on the West Side, North Lawndale, we can make inferences about how similarly disadvantaged neighborhoods and residents in Chicago experienced travel during the pandemic. Using publicly available data, this analysis shows that before the pandemic, North Lawndale residents made an average of 37 trips per year while the average Chicago resident made around 41 rideshare trips per year, with some higher-income communities likely averaging much higher. In 2020, the average North Lawndale made 28 rideshare trips at an average cost of around $11 while the average Chicago resident made only 18 trips. Again, if North Lawndale’s experience is like that of other communities, they likely skew the average upward and most residents averaged significantly fewer than 18 trips. This represents hundreds of dollars in extra spending on transportation during the pandemic, a crude estimate assuming residents outside of North Lawndale paid a similar average fare, North Lawndale spent an average of $110 more in 2020 on rideshare services than residents of other communities. And as has already been mentioned, relying on the average is less informative as most neighborhoods made fewer trips.
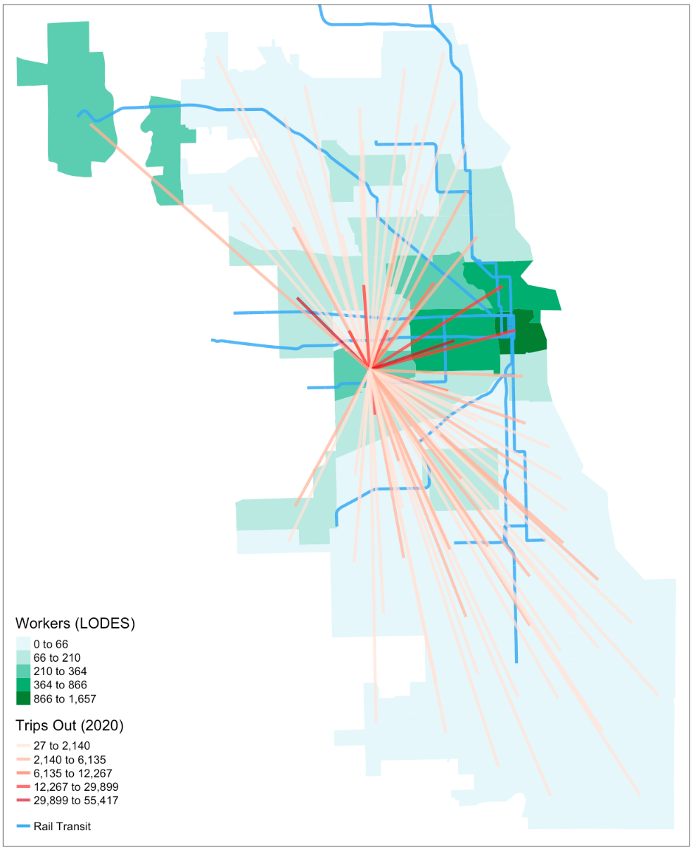
It is also likely that North Lawndale residents made rideshare trips for different or additional reasons than those that travelled in higher-income areas. My focus here has so far been on rideshare with respect to commuting, but we can look at the additional burden of rideshare spending to fulfill everyday needs. Below, we see where trips originating in North Lawndale travelled to, and the number of jobs in that community. As we see, some of the most popular destinations were areas where North Lawndale residents work (U.S. Census Bureau, 2021) but job destinations do not appear to tell the entire story. Many trips were made to nearby neighborhoods with fewer jobs for North Lawndale residents. Instead, we can conclude that some of these were leisure trips, and some were for fulfilling needs such as grocery shopping, medical visits, caring for others, etc. This kind of travel likely happened in both low- and high-income areas but on the South and West sides where car-ownership is low (U.S. Census Bureau, 2020), this trend takes on additional meaning.
As we have learned, transit vehicles were frequently delayed or missing due to worker attrition and sick leave, this on top of the existing challenge of fulfilling daily needs using a transit system that prioritizes connectivity with Downtown. Travelers in this area would need to use bus to get to nearby destinations, explaining why rail ridership is lower to begin with. Though reporting on COVID-19 transit has failed to detail the level of service disruption for bus users, we can assume that bus, which covers a larger area and likely requires many more operators, was more sensitive to operator shortages. So whether the reason for travel was work, leisure, or everyday needs, it is likely that North Lawndale residents and residents of other low-income neighborhoods had to make more trips requiring reliable bus service that was not being provided. The result is a compounding of financial burdens resulting from the need to utilize rideshare and other on-demand services that higher-income residents could afford or avoid due to more alternatives in their neighborhood.
The line of argument here has assumed that all changes in mode can be attributed to transit service, but we can also consider that like other residents, residents of low-income neighborhoods aspire for convenience. Ignoring their choice to avoid transit might strip them of their agency and places the burden of supporting transit on an already burdened group. It also misses a key dynamic that will help transit planners attract ridership in the face of competition and the lasting effects of pandemic travel behavior.
Conclusions
The COVID-19 changed life for many but as always, marginalized groups face additional burdens due to existing patterns of captive travel and low-wages. Here I have suggested that in response to poor transit service, the result of transit operator shortages, likely resulted in many lower-income residents across the city opting to use rideshare services to fill service gaps – North Lawndale residents used rideshare at a rate almost twice the rate of the entire city. Internal heterogeneity of low-income communities has not been explored here but it is likely that not all of North Lawndale used rideshare. It is more likely that a small proportion of the neighborhood used rideshare, those that maintained employment, and used it at rates much higher than the average provided here.
Utilizing rideshare is a reasonable choice given the reports about delays and the fact that we would expect even greater unreliability on bus routes, the dominant travel mode among transit users in the neighborhood. But the issue of transit of rideshare is an old one, it did not begin with transit. Even in the absence of extraordinary delays and given that rideshare use was almost on par with the city in North Lawndale, the choice to utilize rideshare by those for whom the cost is greatest, should be analyzed as a rational choice and taken as a sign that transit is failing to provide the levels of service travelers demands.
Transit ridership is now more sensitive to disruptions as travelers have additional choices where choice is sometimes missing; missing bike infrastructure, missing high-capacity travel options that serve workers outside of Downtown, infrastructure that fails to meet the everyday needs of residents, these missing options can now be filled by rideshare. While this increase in access can be celebrated, it is also issue of financial burden and transit agencies should aim to minimize costs by provide high quality transit options.
References
American Public Transportation Association. (2017). Who Rides Public Transportation: Passenger Demographic & Travel [Report]. Retrieved from https://www.apta.com/wpcontent/uploads/Resources/resources/reportsandpublications/Documents/APTA-Who-Rides-Public-Transportation-2017.pdf
City of Chicago. (2021a). COVID-19 Orders. Chicago.gov. https://www.chicago.gov/city/en/sites/covid-19/home/health-orders.html
City of Chicago. (2021b). Transportation Network Providers – Trips [Dataset]. https://data.cityofchicago.org/Transportation/Transportation-Network-Providers-Trips/m6dm-c72p
City of Chicago. (2021c). CTA – Ridership – ‘L’ Station Entries – Daily Totals [Dataset]. Retrieved from https://data.cityofchicago.org/Transportation/CTA-Ridership-L-Station-Entries-Daily-Totals/5neh-572f
City of Chicago. (2021d). CTA – Ridership – Bus Routes – Daily Total by Route [Dataset]. Retrieved from https://data.cityofchicago.org/Transportation/CTA-Ridership-Bus-Routes-Daily-Totals-by-Route/jyb9-n7fm
City of Chicago. (2020a). CTA – Bus Routes – Shapefile [Shapefile]. Retrieved from https://data.cityofchicago.org/Transportation/CTA-Bus-Routes-Shapefile/d5bx-dr8z
City of Chicago. (2018b). CTA – ‘L’ (Rail) Stations – Shapefile [Shapefile]. Retrieved from https://data.cityofchicago.org/Transportation/CTA-L-Rail-Stations-Shapefile/vmyy-m9qj
City of Chicago. (2018c). Boundaries – Census Tracts – 2010 [Shapefile]. Retrieved from https://data.cityofchicago.org/Facilities-Geographic-Boundaries/Boundaries-Census-Tracts-2010/5jrd-6zik
City of Chicago. (2018d). Boundaries – Community Areas (current) [Shapefile]. Retrieved from https://data.cityofchicago.org/Facilities-Geographic-Boundaries/Boundaries-Community-Areas-current-/cauq-8yn6
City of Chicago. (2016). Boundaries – Zoning Districts (current) [Shapefile]. Retrieved from https://data.cityofchicago.org/Community-Economic-Development/Boundaries-Zoning-Districts-current-/7cve-jgbp
City of Chicago. (2015). CTA – ‘L’ (Rail) Lines – Shapefile [Shapefile]. Retrieved from https://data.cityofchicago.org/Transportation/CTA-L-Rail-Lines-Shapefile/53r7-y88m
Greenfield, J. (2021a, July 27). Transit Association says CTA was the agency that best coped with covid-19 challenges. Streetsblog Chicago. Retrieved December 15, 2021, from https://chi.streetsblog.org/2021/07/26/transit-association-says-cta-was-the-agency-that-best-coped-with-covid-19-challenges/
Greenfield, J. (2021, November 5). Confirmed: Current CTA unreliability is caused by staffing shortages. how do we fix that? Streetsblog Chicago. Retrieved December 15, 2021, from https://chi.streetsblog.org/2021/11/05/confirmed-current-cta-unreliability-is-caused-by-staffing-shortages-how-do-we-fix-that/
Rahimi, E., Shabanpour, R., Shamshiripour, A., & (Kouros) Mohammadian, A. (2021). Perceived risk of using shared mobility services during the COVID-19 pandemic. Transportation Research Part F: Traffic Psychology and Behaviour, 81, 271–281. https://doi.org/10.1016/j.trf.2021.06.012
U.S. Census Bureau (2020). 2015-2019 American Community Survey 5-Year Estimates.
U.S. Census Bureau. (2021). LEHD Origin-Destination Employment Statistics Data (2019). Washington, DC: U.S. Census Bureau, Longitudinal-Employer Household Dynamics Program. accessed on December 9, 2021 at https://lehd.ces.census.gov/data/#lodes. LODES 7.5
Raddue, J. [@SilvestriWoman]. (2021, June 14). No service cuts? Don’t believe it… Whenever I’ve ridden since COVID, Brown Line has been running much farther apart [Tweet]. Twitter.https://twitter.com/SilvestriWoman/status/1404541615956533249
Meholick, A. [@andymeholick]. (2020, August 7). 30 minute delay this morning. Train delays cause crowding at stations and in passenger cars, which puts passengers at a higher risk [Tweet]. Twitter. https://twitter.com/andymeholick/status/1291729097752752129
